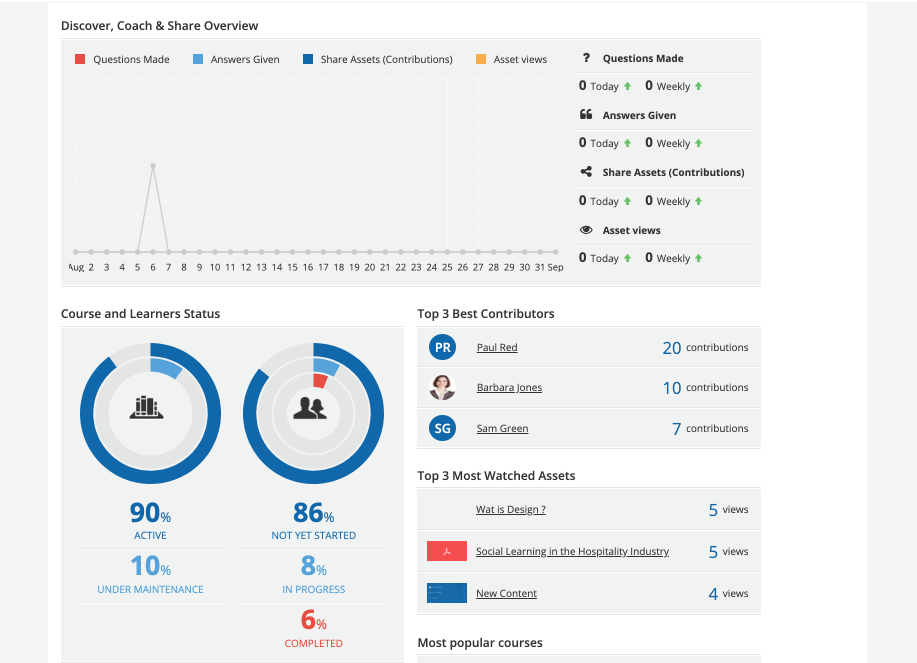
Discover, Coach & Share Overview Graph
If the Discover, Coach & Share module is active in your platform, your Admin Dashboard will also show the Discover, Coach & Share Overview section. This section displays a summary line chart of questions asked, answers given, assets shared, and assets viewed. Statistics can be shown with a daily and weekly timeframe.
The area dedicated to Coach & Share also includes two boxes displaying the top three best contributors in your platform, as well as the top three most-watched assets.
When accessing the Admin Dashboard as a Power User, the statistics that are shown in this section only include users assigned to the Power User profile.
Was this article helpful?
That’s Great!
Thank you for your feedback
Sorry! We couldn't be helpful
Thank you for your feedback
Feedback sent
We appreciate your effort and will try to fix the article
